When retrofitting a multi-building campus with IP-based access control and surveillance, integrators quickly realize that network reliability underpins everything. A single overlooked latency spike can interrupt video feeds during an incident or delay badge reads at critical entry points. Health checks address this by providing ongoing, automated verification of device reachability, bandwidth utilization, and protocol integrity, allowing teams to detect issues before they cascade into operational failures.
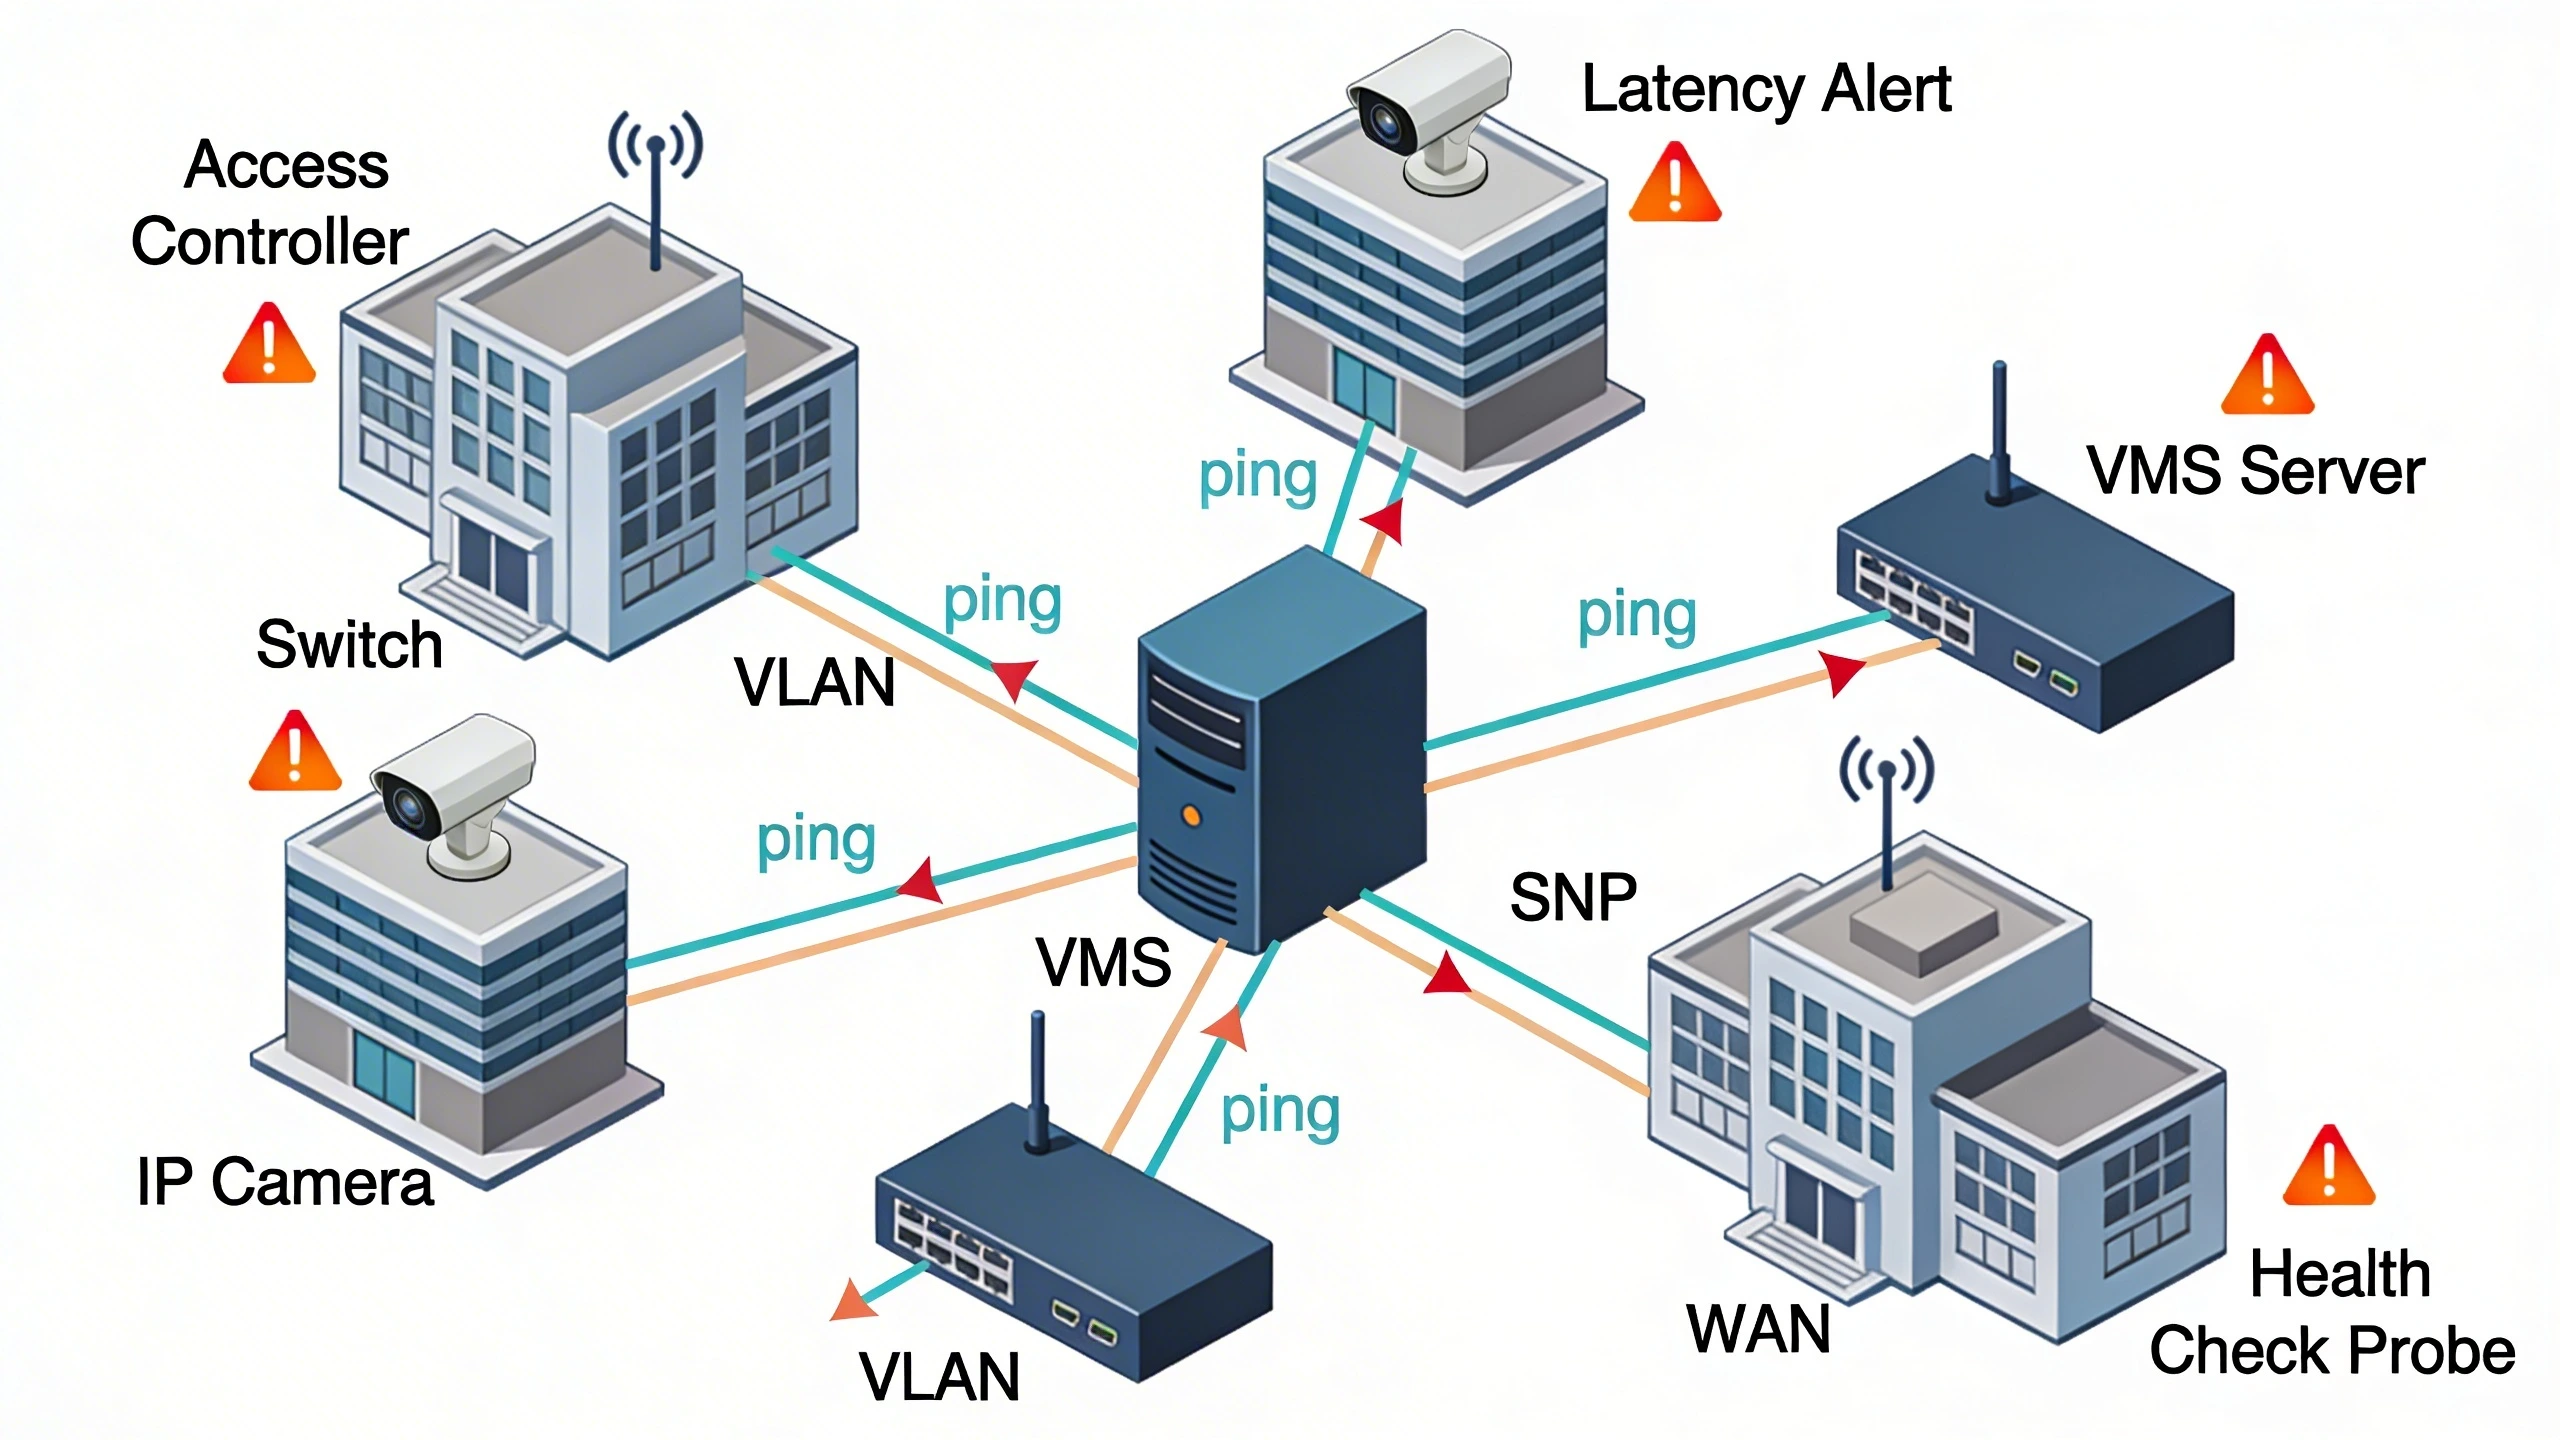
In practice, these checks form the backbone of proactive maintenance for security networks. For instance, at a utility substation spanning remote sites, engineers deploy periodic pings and SNMP polls to confirm camera streams remain stable even under variable WAN conditions. This layered approach outperforms passive logging, as it triggers alerts on thresholds like 200ms round-trip times, enabling rapid isolation without waiting for user reports. The key decision lies in balancing check frequency with overhead, especially in bandwidth-constrained environments.
Selecting the right health check strategy during migration involves weighing open standards against proprietary tools. Standard ICMP echoes offer universal coverage but limited insight, while SNMP provides deeper metrics like CPU load on controllers. Integrators upgrading legacy systems prioritize checks that integrate seamlessly with existing VMS platforms, ensuring continuity while scaling to handle thousands of endpoints.
What the system does in practice
Health checks in security networks continuously probe devices to affirm they are operational, performant, and secure, shifting from reactive troubleshooting to predictive upkeep. In a hospital retrofit, for example, checks monitor door controllers and PTZ cameras across VLANs, flagging jitter that could garble audio from intercoms. This practice catches degradations early, such as a switch overload silently throttling multicast video, preventing gaps in forensic footage.
Beyond basic uptime, effective implementations quantify network health through metrics like packet loss rates and throughput consistency. Teams configure checks to simulate real workloads—say, emulating a 4K stream pull—revealing bottlenecks that static pings miss. When properly tuned, this system reduces mean time to resolution by surfacing root causes, like ARP table exhaustion on edge routers, directly in operator dashboards. The operational payoff is evident in environments where downtime equates to vulnerability exposure.
Real-world deployments emphasize granularity. At a corporate campus, health checks differentiate between endpoint health (e.g., camera firmware responsiveness) and infrastructure health (e.g., PoE switch power budgets), allowing segmented alerting that avoids alert fatigue.
Core components and signal flow
The foundation of any health check system rests on probes, aggregators, and responders embedded in the network fabric. Probes, often hosted on dedicated appliances or virtual instances, initiate queries using ICMP, TCP SYN, or UDP broadcasts tailored to security devices. For an access control panel, a TCP port 80 check verifies web interface availability, while SNMP OIDs pull interface error counters from NVRs.
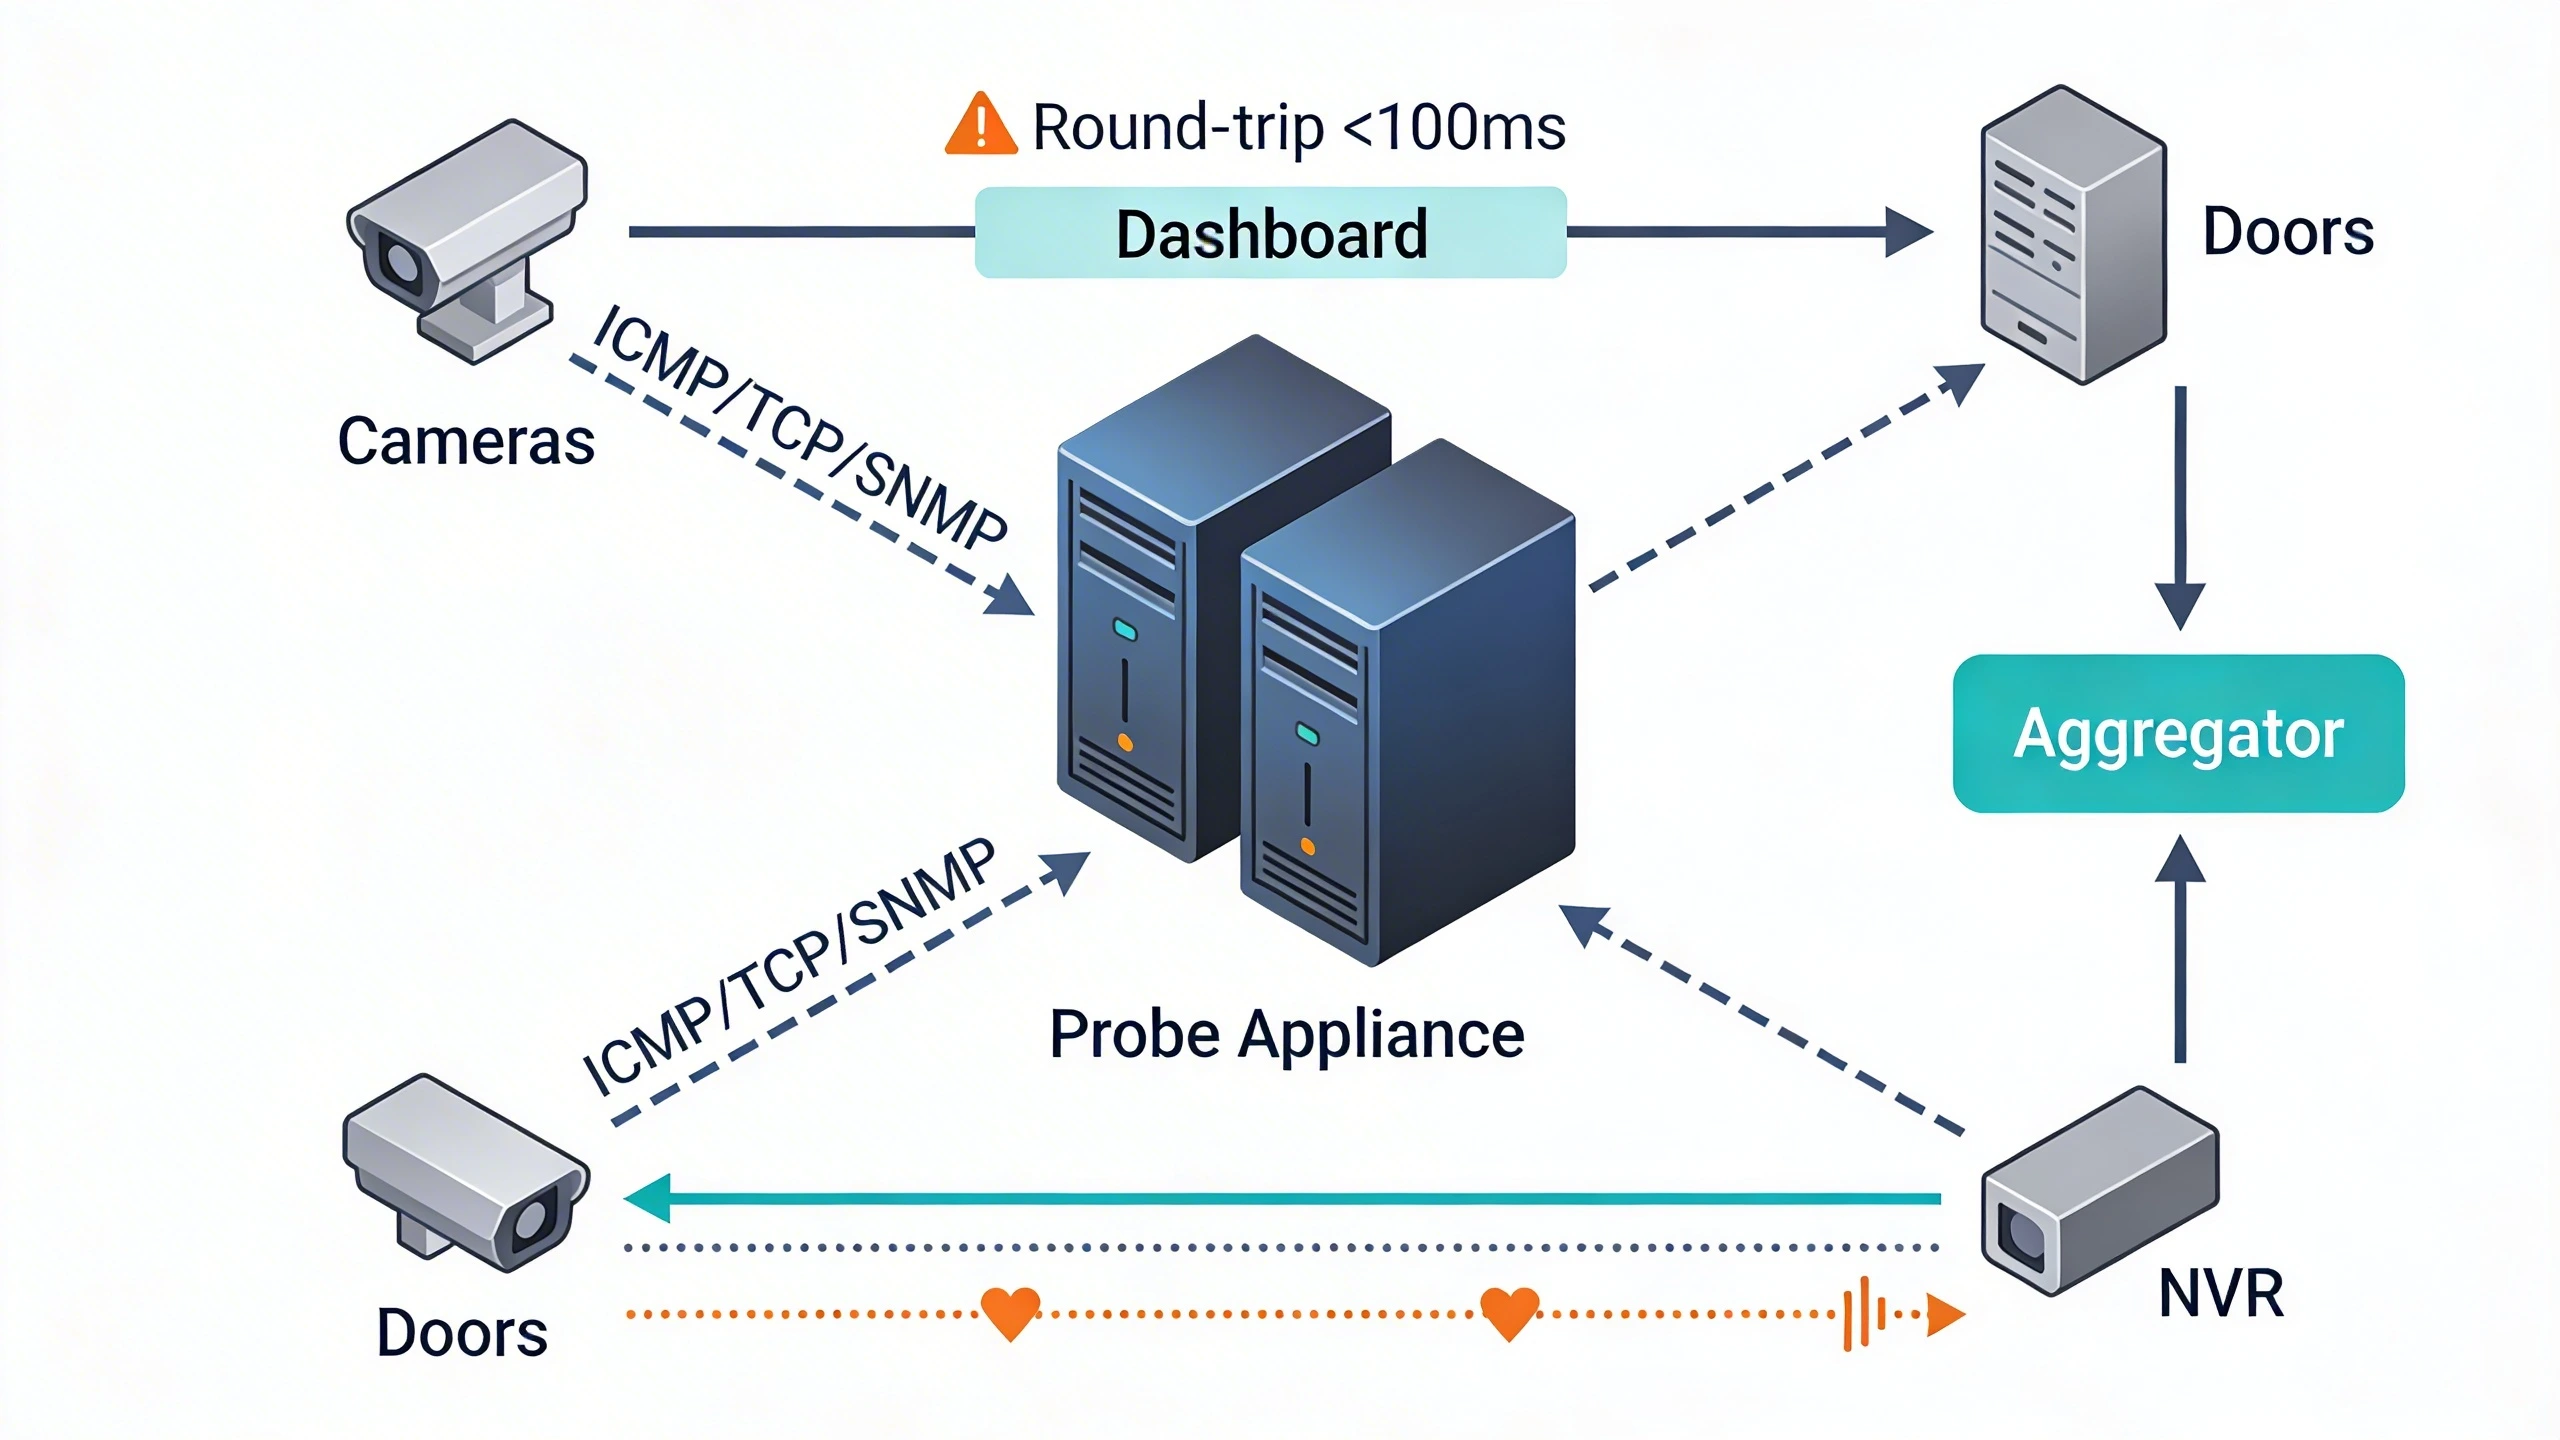
Signal flow typically follows a hub-and-spoke model: probes fan out to endpoints, collect responses, and forward aggregates to a central collector via secure channels like TLS-encrypted syslog. In a distributed setup, such as a chain of retail outlets, edge collectors batch data before uplinking to a cloud aggregator, minimizing WAN chatter. This flow ensures low-latency detection, with round trips under 100ms even across SD-WAN overlays.
Critical to reliability is redundancy in components. Dual-homed probes prevent single points of failure, and devices respond with heartbeats—periodic UDP packets signaling 'alive' status—to complement active polling, reducing false negatives from asymmetric routing.
Deployment and integration considerations
Deploying health checks demands careful segmentation to avoid introducing new failure modes. In a greenfield utility site, place probes in the security DMZ, firewalled to permit only outbound queries on approved ports, preventing lateral movement risks. Integration with existing infrastructure requires mapping device MIBs for SNMP or scripting HTTP endpoints for proprietary cameras, ensuring compatibility without firmware upgrades.
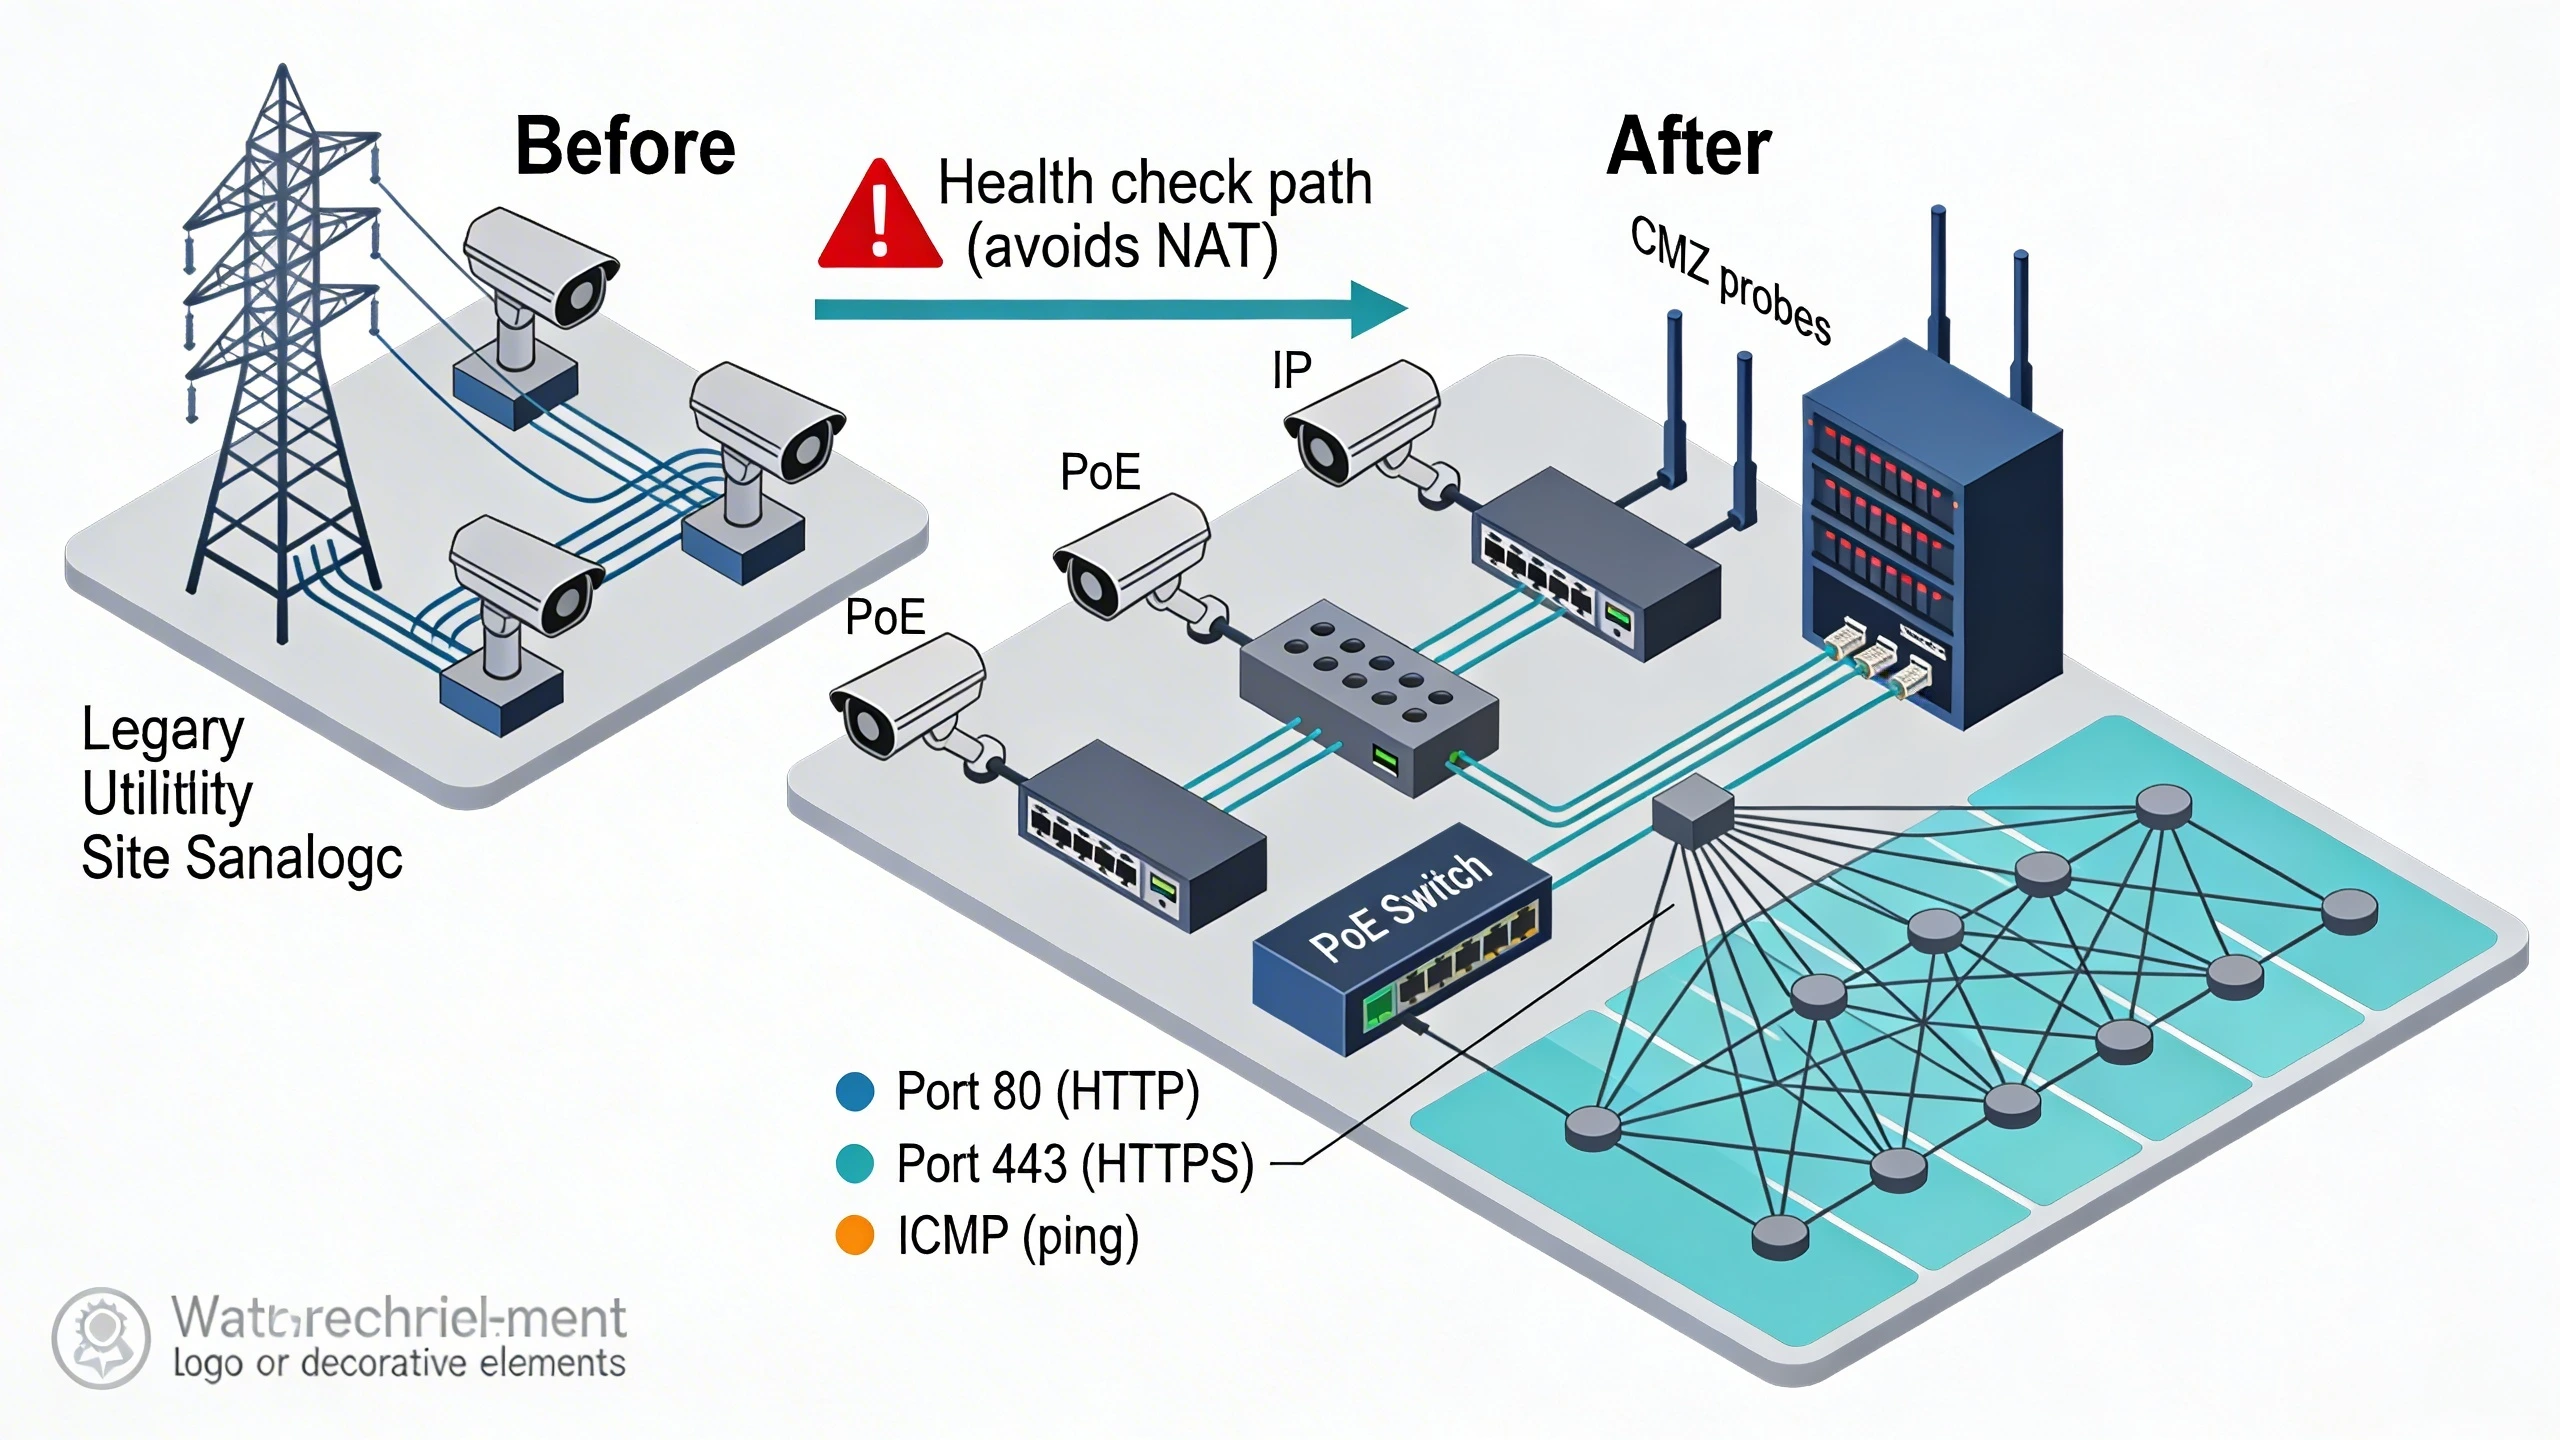
Key tradeoffs emerge in scale: lightweight agents on endpoints suit high-density deployments like parking garages, offloading central processing, while agentless polling favors air-gapped segments. Firewall traversal poses challenges—NAT traversal for STUN-assisted checks or VPN tunnels for remote sites—necessitating pre-staging rules during migration. Successful integrations leverage standards like NTP for timestamp synchronization, aligning check data across time zones.
Budget for observability tools that visualize flows, such as Grafana dashboards fed by Prometheus exporters, to validate deployment efficacy from day one.
Operational workflows and tuning
Daily operations revolve around configuring thresholds and response playbooks. Start with baseline profiling: run checks for a week on a stable network to establish norms, like 1% packet loss max for intercoms. Tuning involves jitter buffers for variable links and exponential backoff on retries, preventing probe storms during flaps.
Workflows integrate with incident management—escalate via PagerDuty on sustained failures, or auto-remediate by flapping ports on PoE injectors. For a multi-site integrator, centralize tuning via YAML configs pushed through Ansible, allowing site-specific overrides for campus versus remote behaviors. Regular audits verify check coverage, simulating outages to test alert fidelity.
- Profile baselines weekly to adapt to seasonal traffic.
- Segment alerts by severity: warn on latency, critical on total loss.
- Review false positives quarterly, refining OID selections.
Common failure points and misconceptions
A prevalent pitfall is over-reliance on ICMP alone, which firewalls often block, masking deeper issues like TCP retransmits crippling video. Misconception holds that vendor dashboards suffice; they typically lag, omitting custom metrics like ONVIF discovery status. In retrofits, ignoring IPv6 dual-stack leads to blind spots on modern endpoints.
Another trap: untuned polling floods low-bandwidth uplinks, exacerbating the problems they monitor. Teams overlook encrypted traffic—HTTPS health checks fail without SNI support—leaving VMS integrations vulnerable. When migrating, stale ARP caches trigger phantom downs, resolved only by proactive MAC learning in checks.
Addressing these requires holistic validation: cross-reference with packet captures and endpoint logs, ensuring checks evolve with network changes like SASE adoption.
Where to go next
Explore how FortSense 4 embeds these practices for streamlined monitoring. For tailored advice on your retrofit, request a design review. Dive deeper into critical infrastructure security or review North America deployments for case parallels. Supporting concepts appear in our VMS glossary.