For a binary PIDS detection test, the required sample size depends on the minimum acceptable detection probability, the required one-sided confidence, and how many valid missed detections the design permits. If every valid trial must succeed, calculate:
n >= ln(alpha) / ln(p0)
Here, p0 is the required detection probability and alpha equals one minus the required confidence. Round the result up to the next whole valid trial.
This design is defensible only when trials are sufficiently independent, conditions represent the claim being made, and every valid trial succeeds. When failures are permitted, use an exact cumulative binomial calculation or exact one-sided lower confidence bound rather than an improvised shortcut. The project requirement must set the target probability and confidence; there is no universal PIDS sample count.
What the Sample Size Is Designed to Demonstrate
A PIDS detection test produces a success, a failure, or a trial excluded under a predefined validity rule. The statistical objective is not merely to calculate the observed success rate. It is to determine whether the evidence supports a minimum underlying probability of detection with the required confidence for the defined test population.
For example, 18 detections in 20 valid trials produce a point estimate of 0.90. That does not demonstrate a true detection probability of at least 0.90 with high confidence. The one-sided lower confidence bound is below the point estimate because the sample is finite.
State the required probability p0 and the one-sided confidence level.
Define exactly what outcome counts as a successful detection.
Report valid trials, successful detections, and valid missed detections.
Name the exact statistical method and analysis tool.
Limit the conclusion to the fence, threat, zone, environment, and configuration represented.
The Sandia Security Technology Testing and Evaluation Manual treats detect or no-detect results as binomial data and describes performance using probability with a lower confidence level. It also emphasizes defining the test matrix and parameters before execution.
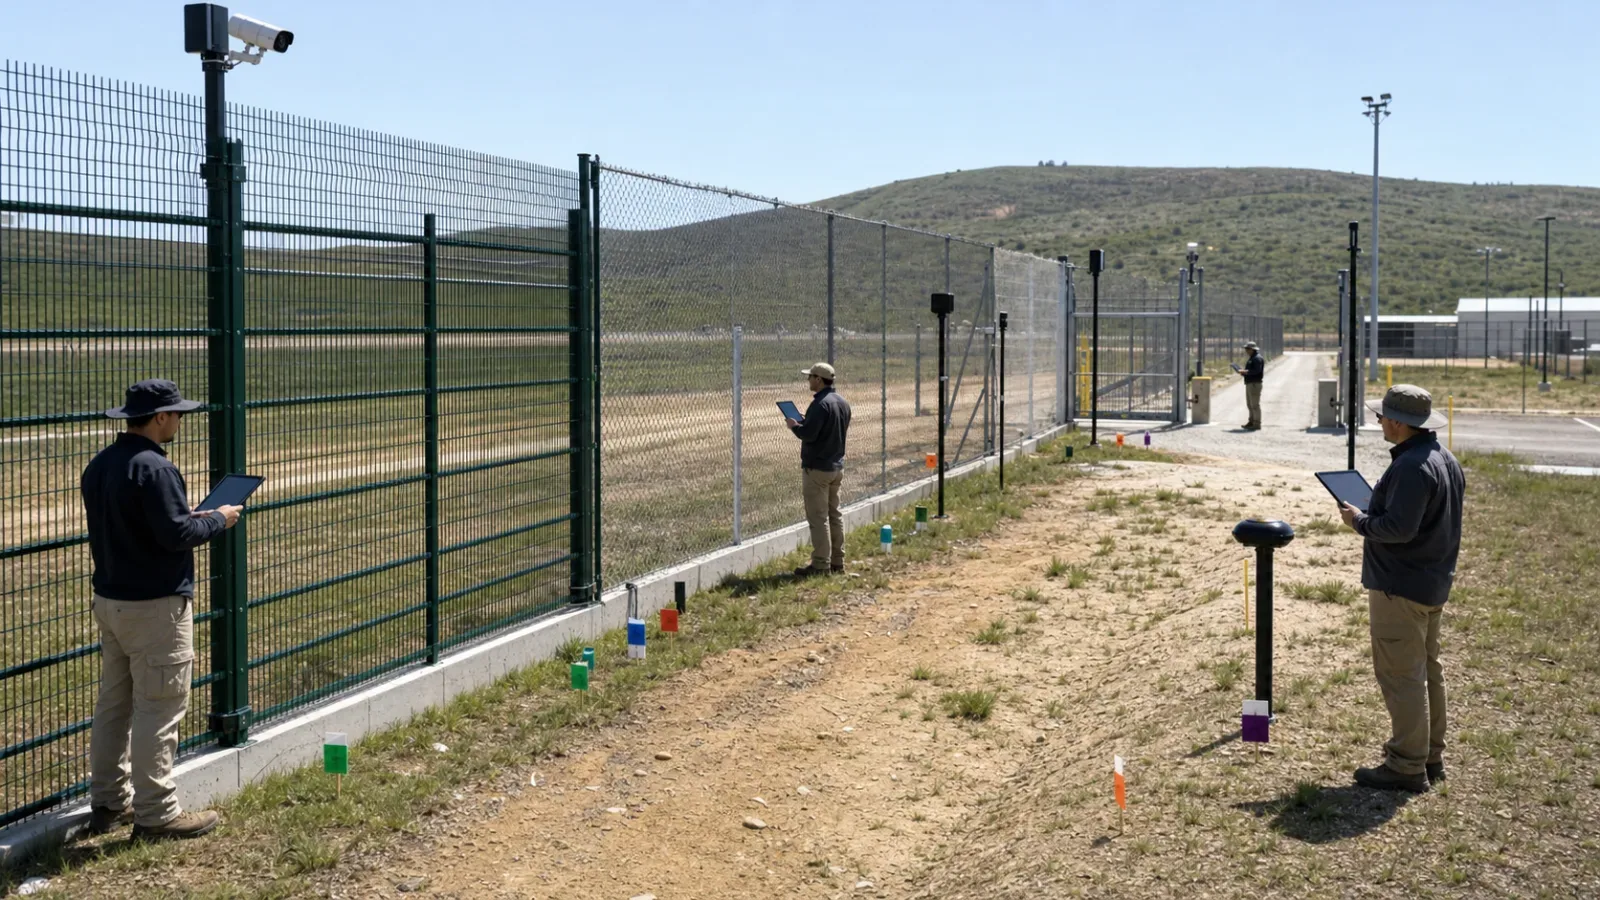
Inputs Worksheet for PIDS Sample-Size Planning
Detection event: define the exact alarm or workflow outcome that counts as success.
Minimum probability p0: set the performance threshold through the operational or procurement requirement.
One-sided confidence: set the evidence standard through the competent project authority.
Allowed failures: choose zero or a precomputed maximum before testing begins.
Threat method: define each climb, cut, dig, walk, crawl, or vehicle scenario in scope.
Test population: identify the barrier, zone, sensor route, configuration, and environment covered by the claim.
Strata: separate materially different threats, fence types, soil conditions, weather regimes, and system baselines.
Independence controls: plan resets, spacing, route variation, randomization, and tester behavior.
Invalidity rules: define exclusions before results are visible so misses cannot be removed selectively.
Statistical method: freeze the exact lower bound or exact binomial acceptance rule and the validated analysis tool.
Operational blinding, role separation, randomization, ground truth, and retesting belong in the blind PIDS intrusion testing protocol. The full factory and site acceptance process remains in the PIDS acceptance and witness guide.
Zero-Failure Sample-Size Formula
When every valid trial must succeed, the smallest sample is:
n >= ln(alpha) / ln(p0)
If the true probability were only p0, the probability of observing n successes in n independent trials would be p0 raised to n. The test chooses n so that p0 raised to n is no greater than alpha. Solving that inequality produces the logarithmic formula.
Illustrative All-Success Designs
p0 0.90 at 90% one-sided confidence: 22 valid trials, requiring 22 successes.
p0 0.90 at 95% one-sided confidence: 29 valid trials, requiring 29 successes.
p0 0.95 at 90% one-sided confidence: 45 valid trials, requiring 45 successes.
p0 0.95 at 95% one-sided confidence: 59 valid trials, requiring 59 successes.
p0 0.99 at 95% one-sided confidence: 299 valid trials, requiring 299 successes.
These are mathematical examples, not recommended PIDS thresholds. They support the stated claim only when the binomial assumptions are credible and every valid trial succeeds. A procurement document should state the governing convention and exact method before testing rather than switch between rounded reference tables and formulas after results are known.

Designs That Allow Missed Detections
A zero-failure design can be expensive and unforgiving: one valid miss defeats the all-success rule. A project may allow a predefined number of failures with a larger sample, but that boundary must be calculated with the exact binomial distribution.
For a design with n trials and no more than a stated number of failures, evaluate the applicable cumulative binomial tail at p0 or calculate the exact one-sided lower confidence bound for the observed successes. Confirm that the resulting bound meets the required probability.
Do not substitute a fixed success percentage, an unjustified normal approximation, required probability multiplied by sample size, a rounded observed rate, or an improvised adjustment to the zero-failure formula. The NIST pass-fail testing paper explains the relationship between binary observations, confidence bounds, and hypothesis tests. Use a statistician or validated tool for an allowed-failure plan and freeze n, the maximum failures, confidence method, and decision rule before trials.
Point Estimates Are Not Confidence-Supported Claims
The observed detection rate is successes divided by valid trials. It summarizes the sample but does not express uncertainty. Nine successes in ten trials and ninety in one hundred both produce a 0.90 point estimate, yet the larger sample supports a narrower confidence interval.
Report the observed rate and the exact one-sided lower confidence bound. A statement such as "the system achieved 95% detection" is incomplete without the trial count, valid misses, confidence method, and represented test population.
Localization accuracy is a separate metric. Chainage offsets, distance errors, percentiles, and error distributions belong in the fiber PIDS localization-accuracy guide, not inside a binary detection denominator.
Stratify Conditions Before Calculating the Matrix
Pooling unlike conditions can produce a rate that represents none of them adequately. If one barrier condition records 20 detections in 20 trials and a damaged repair section records 10 in 20, the pooled 30 in 40 conceals a configuration-specific weakness. It should not support a claim that both conditions share one probability.
Fence or barrier type and installation condition
Sensor route, attachment, processor, hardware, firmware, and configuration
Intrusion or target method
Zone, approach direction, and distance from transitions
Buried soil and coupling condition
Weather, vegetation, traffic, and other environmental regime
Original versus repaired or replacement perimeter sections
Each claimed stratum needs enough evidence for its own conclusion. When a sample is too small, label it exploratory instead of using an aggregate rate to imply assurance. The fiber PIDS proof-of-concept plan can identify influential conditions before formal acceptance is frozen.
Protect the Independence Assumption
The binomial model assumes trials are independent and have a stable probability of success within the evaluated population. That assumption weakens when the same location is attacked without reset, testers learn how to trigger the sensor, operators anticipate events, a trial changes the fence or soil, adaptive processing carries information forward, weather changes inside a pooled block, several attempts share one disturbance, or settings change during testing.
Perfect independence may be difficult in the field, but the plan should reduce known dependencies and disclose the limitations. More repetitions do not repair a biased or dependent test.
Handle Invalid Trials and Missed Detections Correctly
Write validity rules before execution. A safety stop, incorrect method, failed ground-truth record, or unauthorized configuration change may invalidate a trial. Keep it in the register with its exclusion reason and do not include it in the valid denominator.
A valid missed detection is not invalid because it harms acceptance. If the approved method was executed correctly under valid conditions and the required outcome did not occur, record a failure. Replace invalid trials when the plan requires a fixed valid count; never replace valid failures selectively.
Nuisance alarms need their own observation and reporting method. Use the PIDS false-alarm troubleshooting guide for operational diagnosis rather than mixing nuisance counts into the binary detection sample.
Sample-Size Decision Workflow
Define the claim. Specify the sensor configuration, threat, perimeter condition, and environment covered.
Set the requirements. Approve the minimum probability and one-sided confidence.
Choose the failure rule. Decide whether all valid trials must succeed or an exact allowed-failure design applies.
Identify the strata. Separate unlike threats, barriers, zones, and environmental conditions.
Assess independence. Design resets, spacing, randomization, and configuration control.
Calculate each sample. Use the logarithmic all-success rule or an exact binomial method.
Freeze the matrix. Approve counts and acceptance boundaries before field evidence is visible.
Execute and preserve. Follow the controlled protocol and retain every valid, failed, and invalid record.
Calculate exact results. Report point estimates and one-sided lower confidence bounds.
Limit the conclusion. Claim performance only for the tested population and baseline.
NPSA distinguishes among PIDS categories and evaluates products in defined deployment configurations. Product evaluation does not remove the need to test the installed system against the site operational requirement. See the NPSA PIDS guidance and evaluation schemes.
Reporting Checklist
State the required probability, one-sided confidence, failure rule, and exact method.
Identify what counted as a successful detection and which workflow stage was measured.
Report total, valid, invalid, successful, and failed trials without deleting exclusions.
Report the point estimate and exact one-sided lower confidence bound.
Show outcomes by every predefined stratum and disclose pooling decisions.
Record dependencies, deviations, environmental changes, and configuration interventions.
Preserve the fence, sensor, zone, firmware, software, and settings baseline.
Distinguish detection, localization, timing, verification, and nuisance-alarm results.
Retain the approved calculation, software output, matrix, register, raw evidence, and signed conclusion.

Implementation Note
Build the statistical plan into the requirements verification matrix before procurement or site acceptance. The owner, test director, integrator, and statistical reviewer should approve the threshold, confidence, strata, allowed failures, and calculation method before field execution.
For critical-infrastructure perimeter security, keep the calculation workbook, software output, controlled test matrix, baseline, trial register, source evidence, deviations, and signed conclusions under document control. Review how FortSense 4 supports the zone and verification workflow, then request a project review before freezing the acceptance matrix.
Source and Scope Controls
Exact pass/fail confidence and hypothesis-test logic: NIST pass-fail testing paper.
Binomial distribution and confidence references: NIST Engineering Statistics Handbook.
Physical-security test planning and detect or no-detect evidence: Sandia test and evaluation manual.
PIDS selection, commissioning, and environment context: NPSA PIDS guidance.
Configuration-specific product evaluation: NPSA PIDS evaluation schemes.
For nuclear perimeter witness tests, pair sample-size planning with the nuclear-facility PIDS design guide.